Student Skills Report Redesign
Student Skills Report Redesign
Student Skills
Report Redesign
Improving how teachers understand student growth, strengths, and learning gaps through clearer, more actionable skill insights.
Improving how teachers understand student growth, strengths, and learning gaps through clearer, more actionable skill insights.
Improving how teachers understand student growth, strengths, and learning gaps through clearer, more actionable skill insights.
Roles & Responsibilities
Roles & Responsibilities
Roles & Responsibilities
Product Designer
Product Designer
Product Designer
Led the usability redesign of the Student Skills Report for teachers.
Turned research insights into tested, actionable design decisions.
Worked cross-functionally to deliver the feature to production.
Led the usability redesign of the Student Skills Report for teachers.
Turned research insights into tested, actionable design decisions.
Worked cross-functionally to deliver the feature to production.
Led the usability redesign of the Student Skills Report for teachers.
Turned research insights into tested, actionable design decisions.
Worked cross-functionally to deliver the feature to production.
Project Context
Project Context
Project Context
Timeline: October 2024 – December 2025
Timeline: October 2024 – December 2025
Timeline: October 2024 – December 2025
Company: Mathspace🇦🇺 (EdTech)
Company: Mathspace🇦🇺 (EdTech)
Company: Mathspace🇦🇺 (EdTech)
Product Area: Teacher Experience
Product Area: Teacher Experience
Product Area: Teacher Experience
Context
Context
Context
This project was my first assignment after joining Mathspace.
This project was my first assignment after joining Mathspace.
This project was my first assignment after joining Mathspace.
While the Student Skills Report already existed, it had not been meaningfully iterated on since the initial Waypoints release.
For Mathspace to remain competitive, especially in the US market (e.g. Virginia) decision makers and teachers need a clear, trustworthy way to see student growth. District administrators, in particular, rely on this visibility to justify adoption and continued use of the platform.
At the same time, teachers were already generating a wealth of assessment data through check-ins. The challenge was not the lack of data, but how effectively that data was being communicated and used.
Problem Statement
Problem Statement
Problem Statement
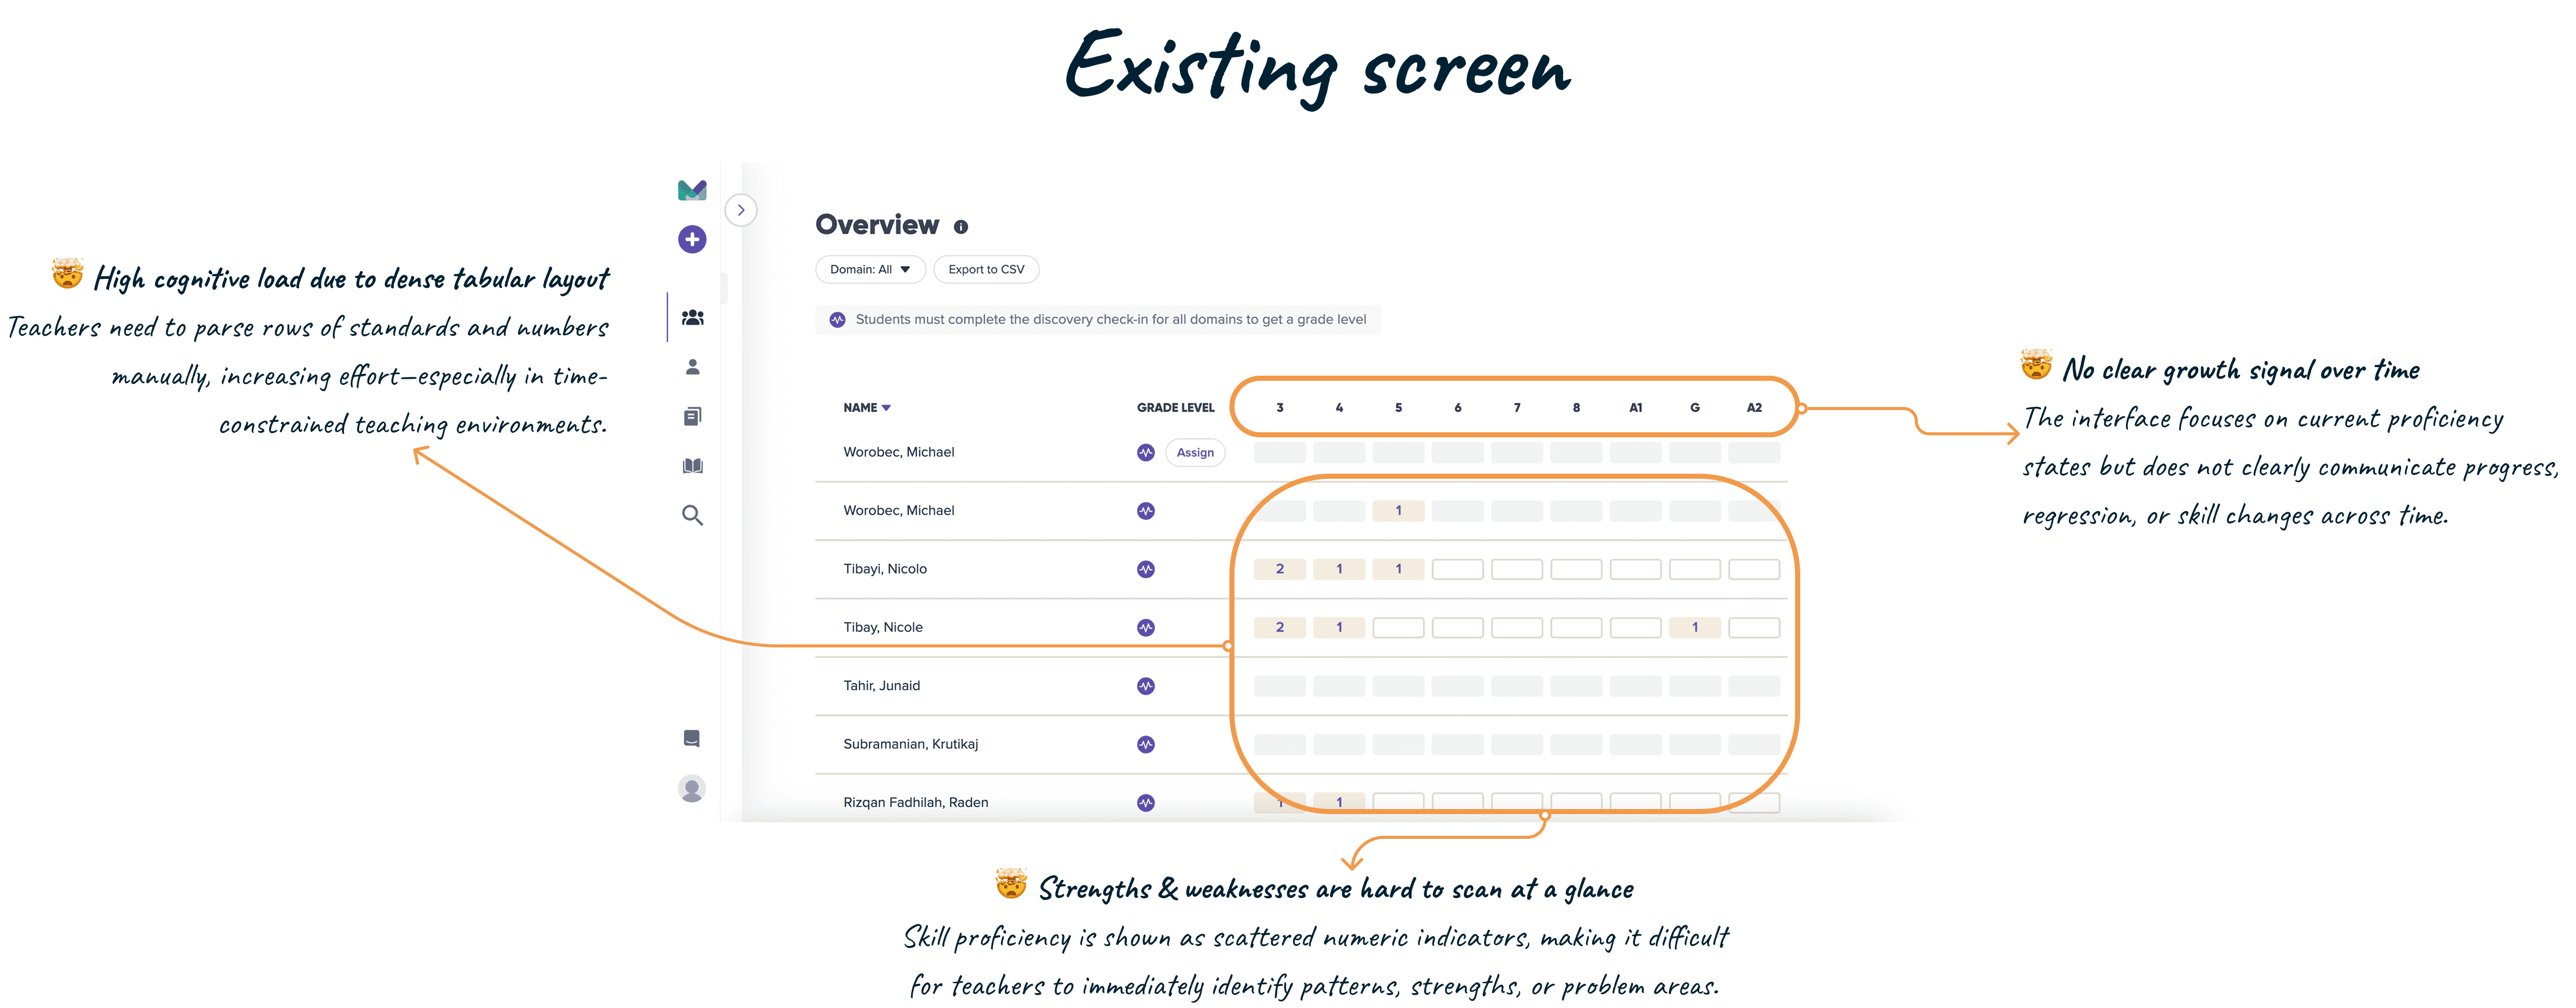
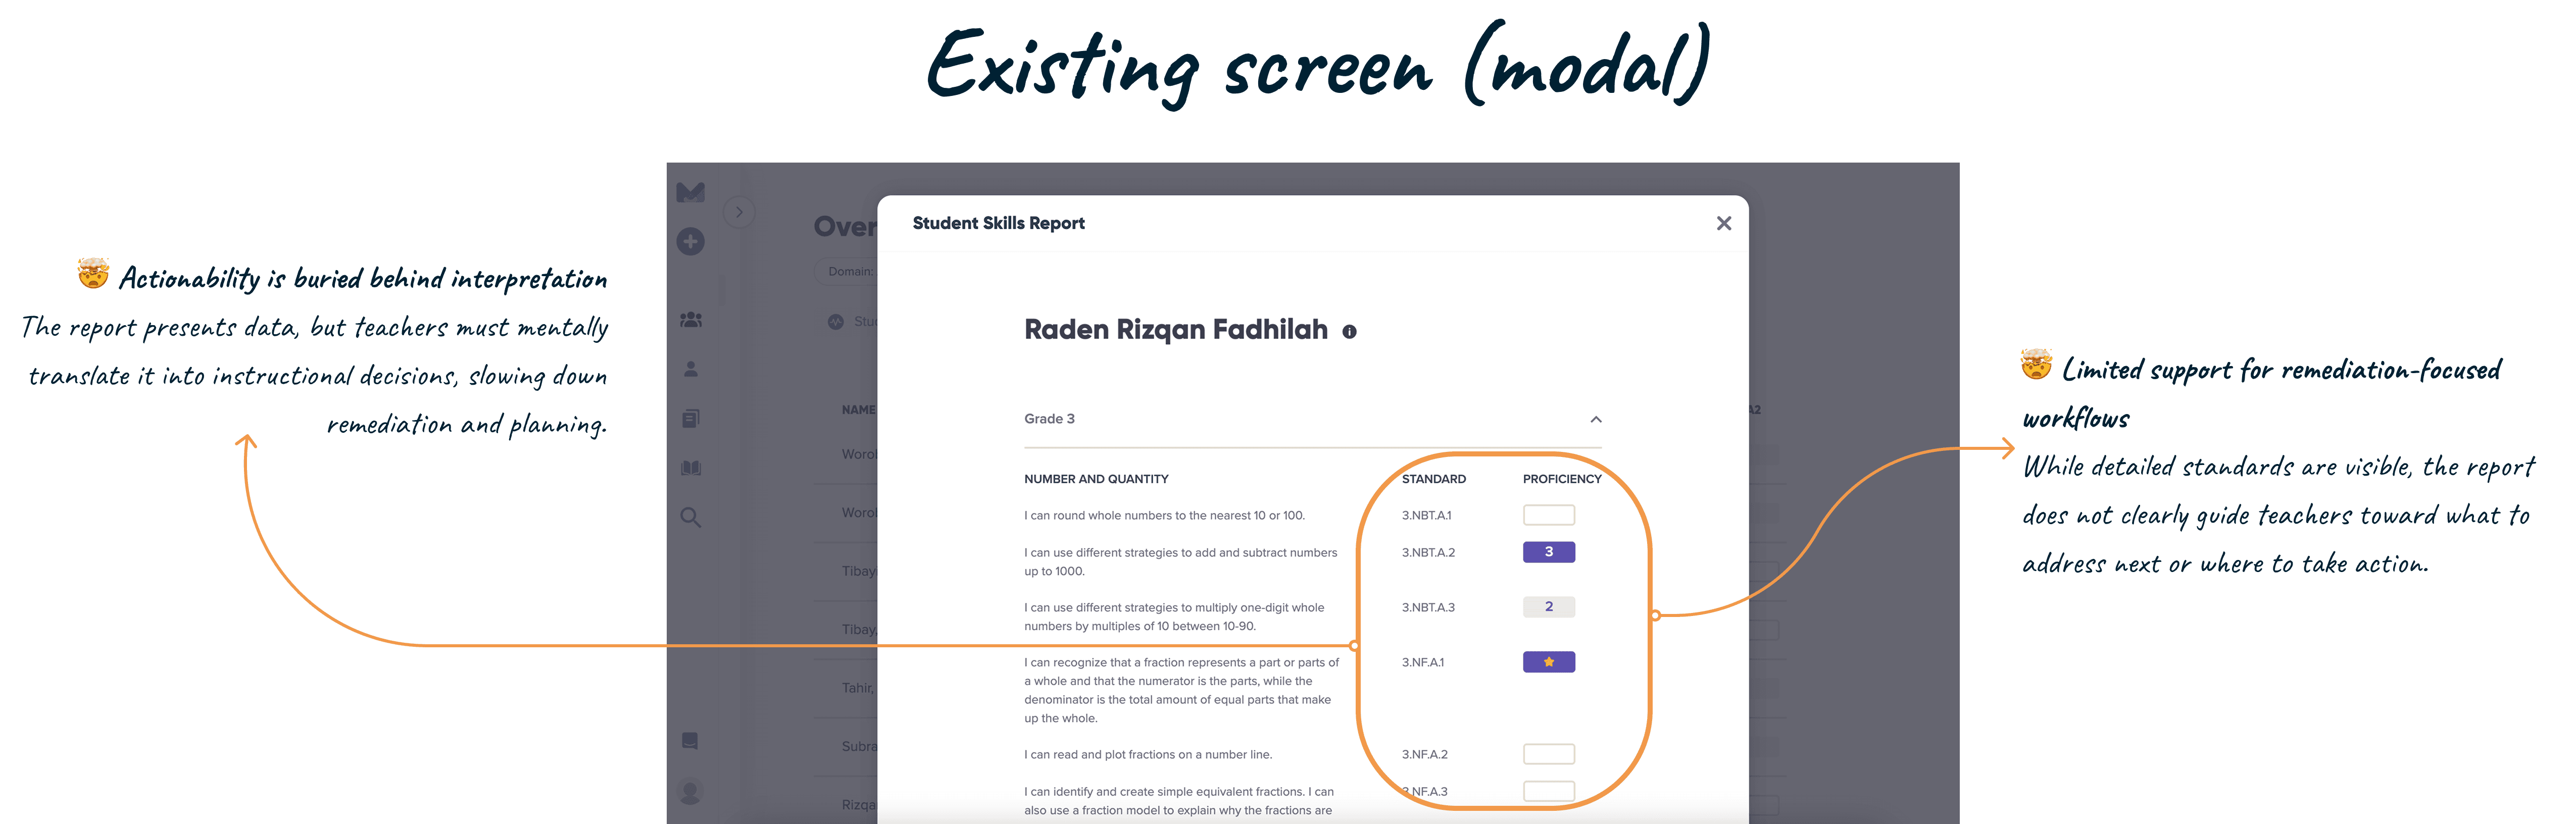
The existing student report page:
Lacked clarity in highlighting student strengths and weaknesses
Made it difficult for teachers to quickly identify learning gaps
Did not clearly support remediation-focused teaching workflows
This project focused solely on improving report usability and actionability, assuming the data itself was already available.
Goals
Goals
Goals
From a usability and product perspective, the goals were to:
Help teachers quickly understand student growth over time
Make it easy to identify learning gaps and take action
Improve clarity without increasing cognitive load
Establish a scalable foundation, starting from:
Student Skills Report → Class Skills Report → District Admin Skills Report
Research Foundation
Research Foundation
Research Foundation
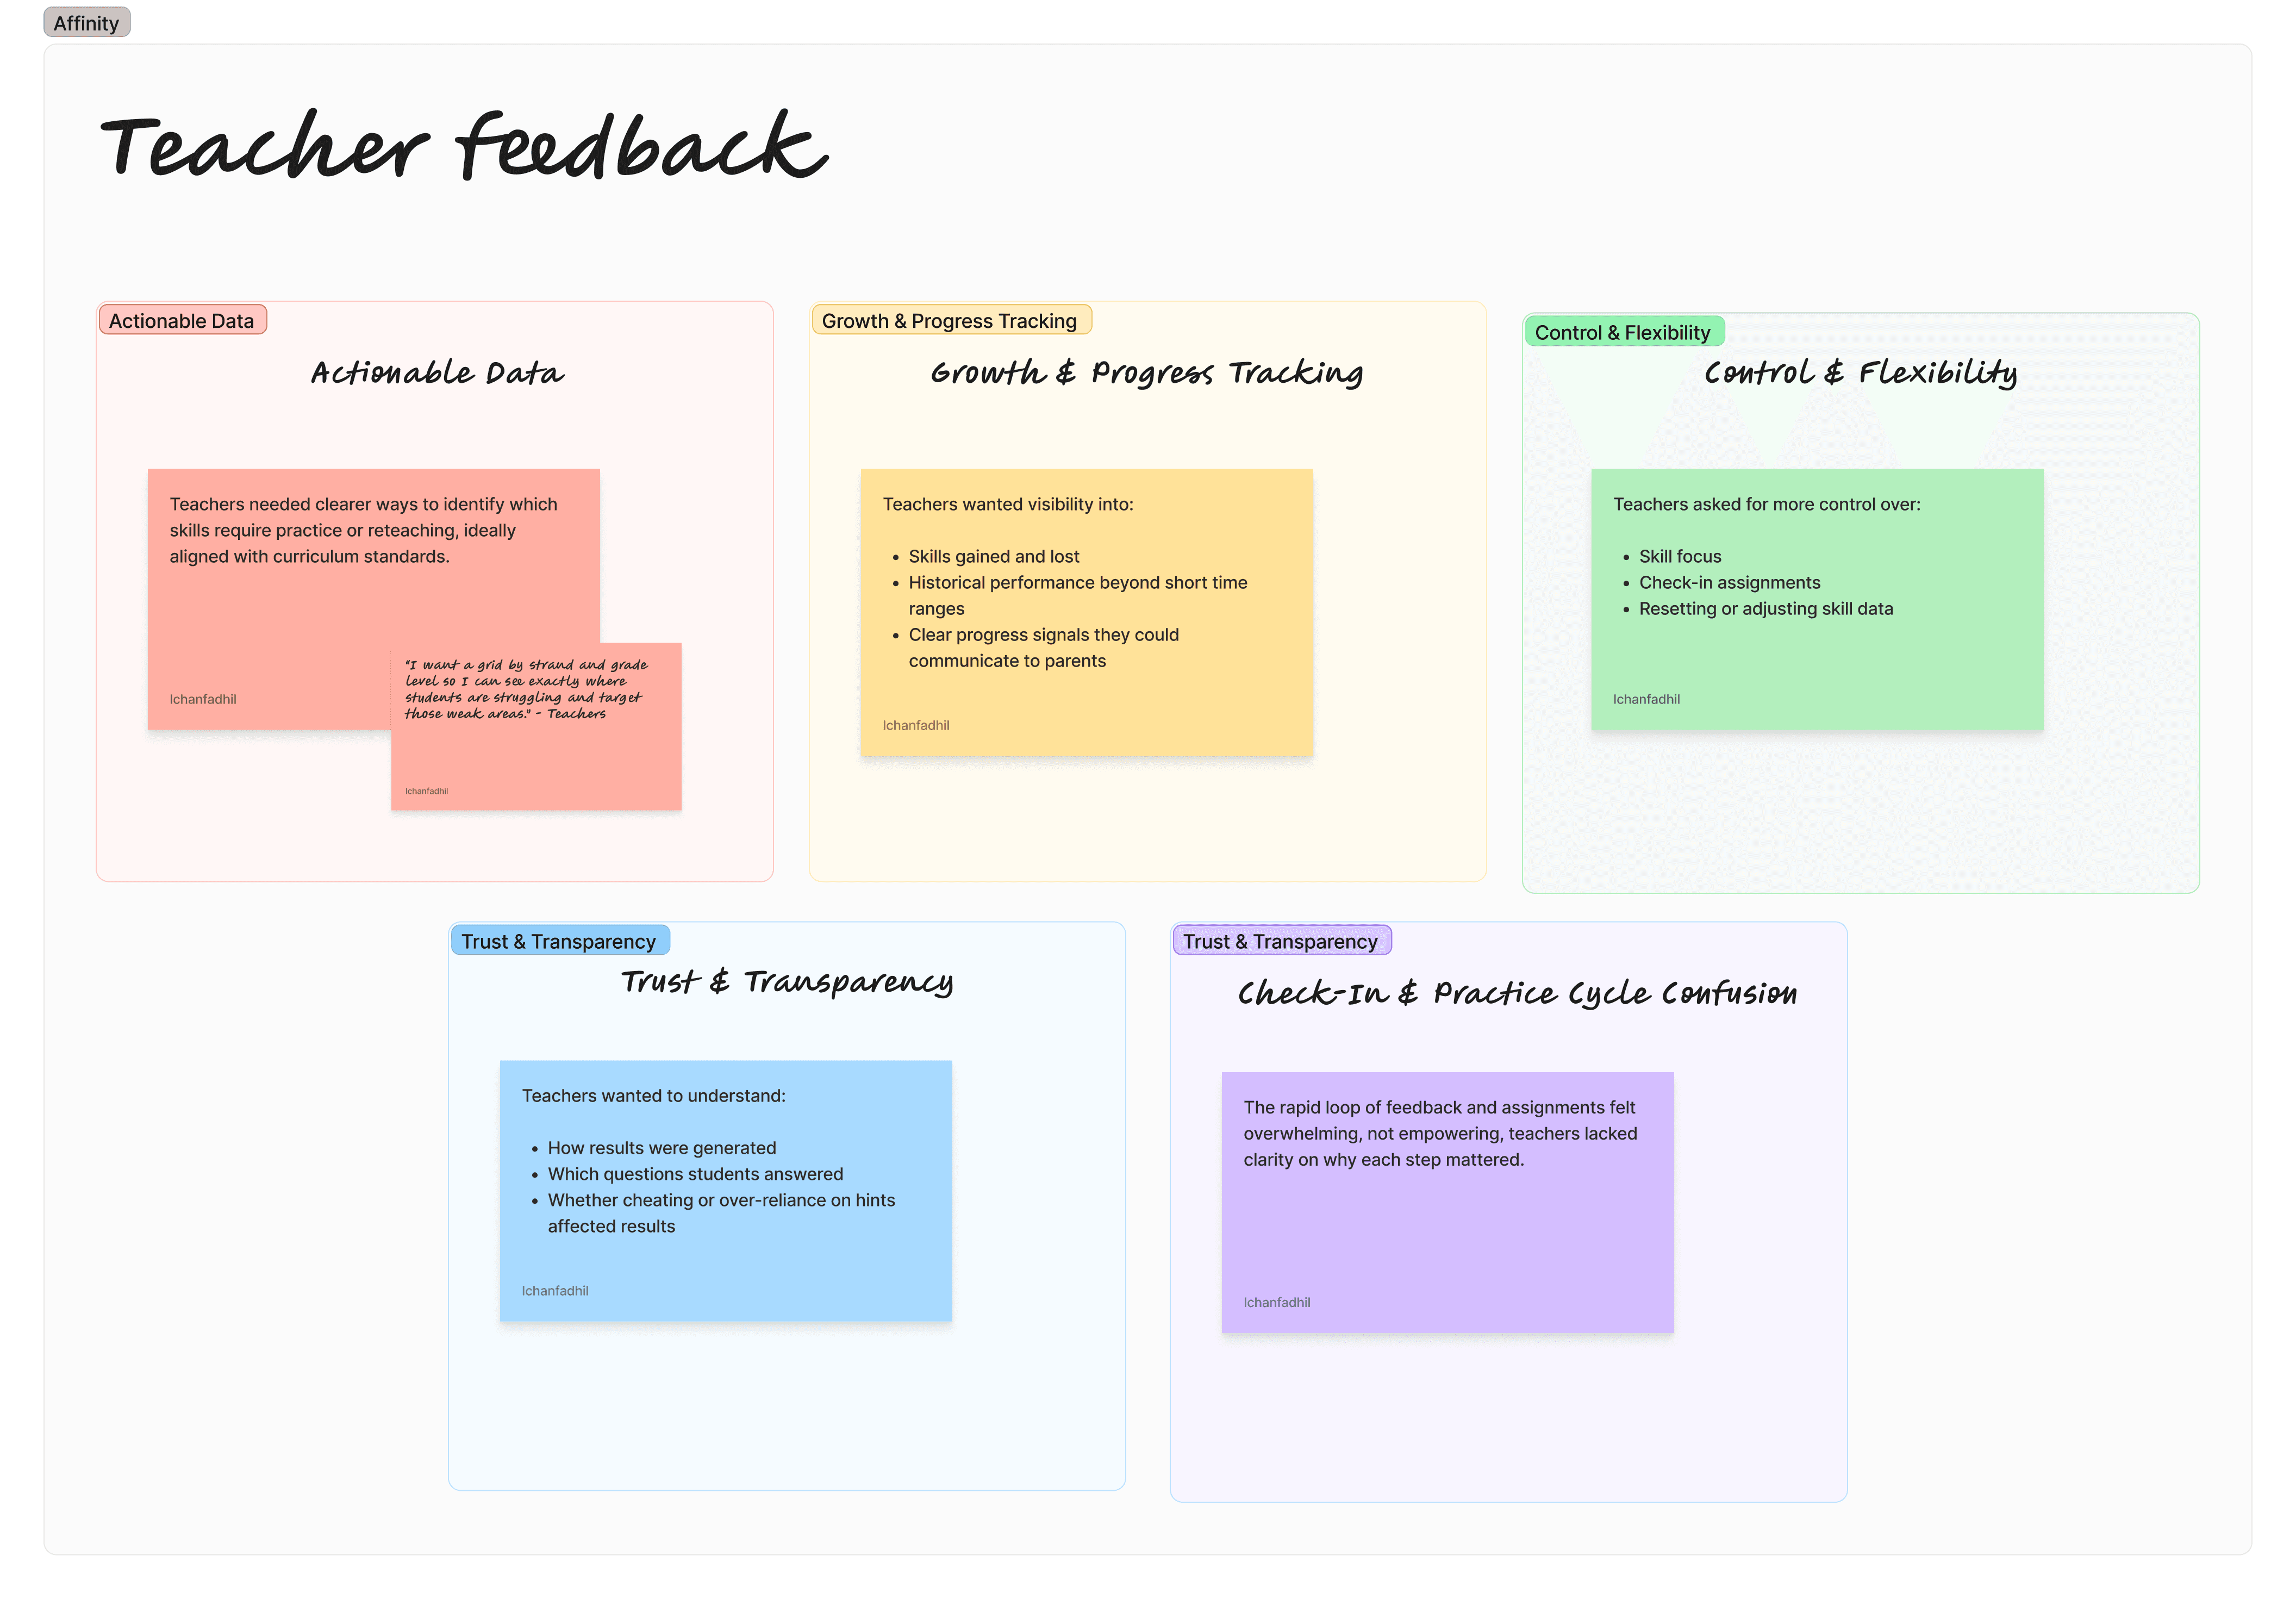
Before I joined the team, user research had already been conducted by a researcher. Rather than repeating discovery, I focused on synthesizing existing insights and translating them into clear design directions.
Key themes from teacher feedback included:
Before I joined the team, user research had already been conducted by a researcher. Rather than repeating discovery, I focused on synthesizing existing insights and translating them into clear design directions.
Key themes from teacher feedback included:
Before I joined the team, user research had already been conducted by a researcher. Rather than repeating discovery, I focused on synthesizing existing insights and translating them into clear design directions.
Key themes from teacher feedback included:
Design Approach
Design Approach
Design Approach
Given the clarity of the problem space and the availability of strong research insights, I moved directly into solution framing.
Instead of running new discovery rounds, I focused on:
Translating real teacher workflows into clear user flows
Exploring layouts that optimized first-glance comprehension
Designing for signal over detail
Early Exploration
Early Exploration
Early Exploration
I created two layout options for the Skills Summary section:
I created two layout options for the Skills Summary section:
I created two layout options for the Skills Summary section:

Based on stakeholder feedback, we decided to skip low-fidelity validation and move directly into high-fidelity designs for real user testing.
This approach aligned with Mathspace’s culture:
testing with real users early and often, without being overly constrained by rigid frameworks.
Based on stakeholder feedback, we decided to skip low-fidelity validation and move directly into high-fidelity designs for real user testing.
This approach aligned with Mathspace’s culture:
testing with real users early and often, without being overly constrained by rigid frameworks.
Based on stakeholder feedback, we decided to skip low-fidelity validation and move directly into high-fidelity designs for real user testing.
This approach aligned with Mathspace’s culture:
testing with real users early and often, without being overly constrained by rigid frameworks.
Validation & Testing
Validation & Testing
Validation & Testing
To validate clarity and comprehension, I tested both layout options directly with teachers using a 5-second test.
The goal was simple:
To validate clarity and comprehension, I tested both layout options directly with teachers using a 5-second test.
The goal was simple:
To validate clarity and comprehension, I tested both layout options directly with teachers using a 5-second test.
The goal was simple:
Can teachers immediately understand student strengths and weaknesses at a glance?
Can teachers immediately understand student strengths and weaknesses at a glance?
Can teachers immediately understand student strengths and weaknesses at a glance?
Outcome
Outcome
Outcome
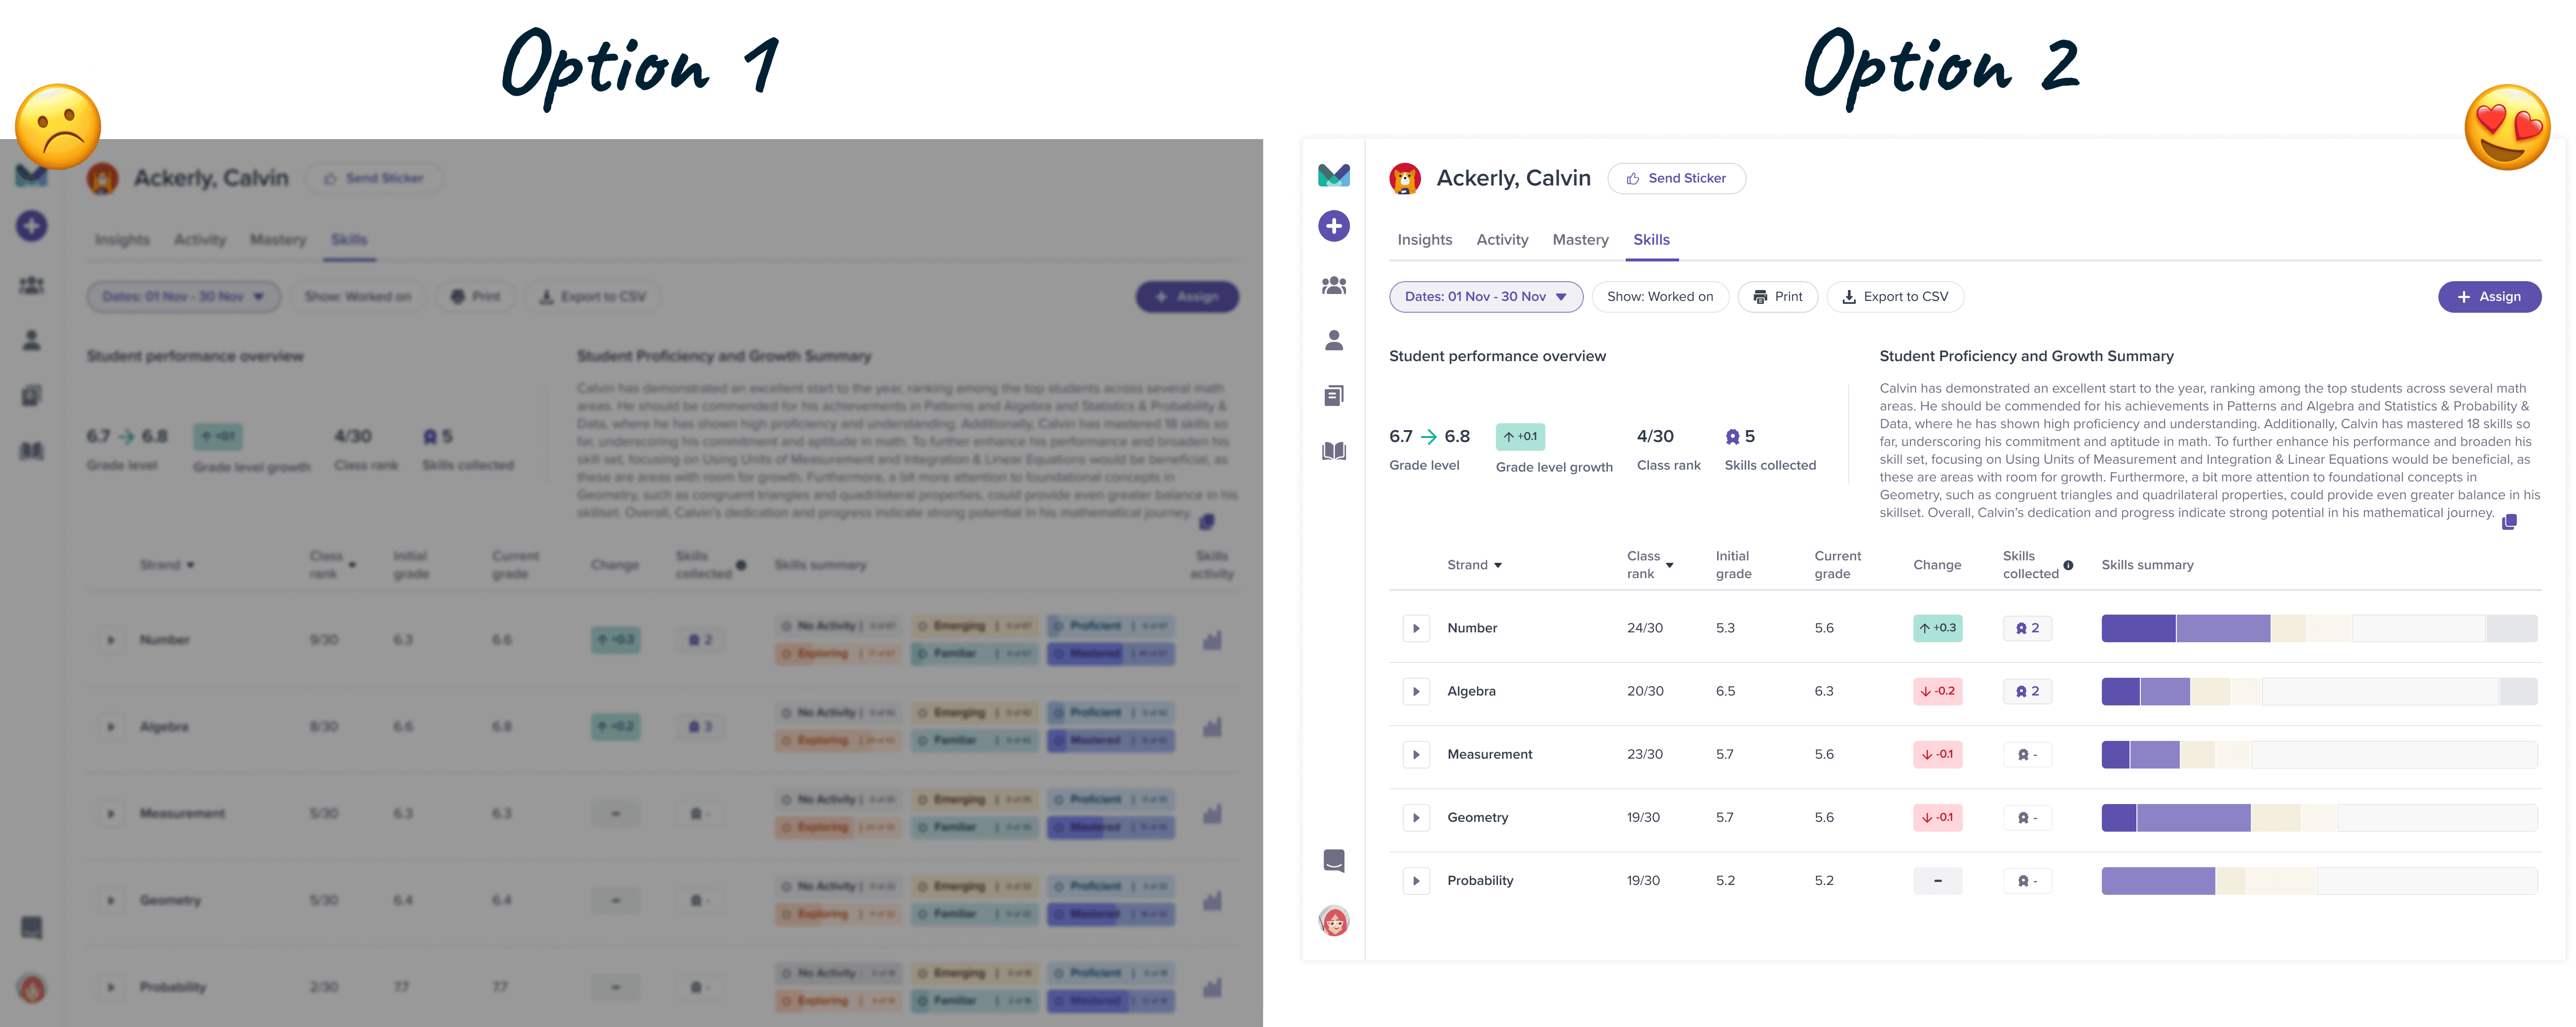
All participants showed a clear preference for Option 2 (bar-based layout), finding it significantly easier to understand skill gaps compared to the pill-based version.
The numeric indicators in Option 1 were ambiguous, with insufficient contrast between empty and partially filled states.
Teachers appreciated that the bar view showed only relevant mastery levels, reducing unnecessary visual noise once skills were fully mastered.
Hover states provided just enough context to understand mastery definitions without overwhelming the interface.
Participants responded positively to Mathspace-generated summaries and indicated they would use them for reporting and parent communication.
Design Takeaways
Design Takeaways
Design Takeaways
Visual simplicity matters more than completeness when teachers are scanning for gaps under time pressure.
Reducing visible elements once mastery is achieved helps lower cognitive load and improve pattern recognition.
Visual summaries are valuable only when they are actionable, teachers expect clear pathways from insight to intervention.
These insights directly informed the final layout direction and interaction model.
These insights directly informed the final layout direction and interaction model.
These insights directly informed the final layout direction and interaction model.
Final Design & Delivery
Final Design & Delivery
Final Design & Delivery
After validating the preferred layout direction, the design was refined and confirmed through usability testing before being handed off for development.
After validating the preferred layout direction, the design was refined and confirmed through usability testing before being handed off for development.
After validating the preferred layout direction, the design was refined and confirmed through usability testing before being handed off for development.
Final Design
Final Design
Final Design

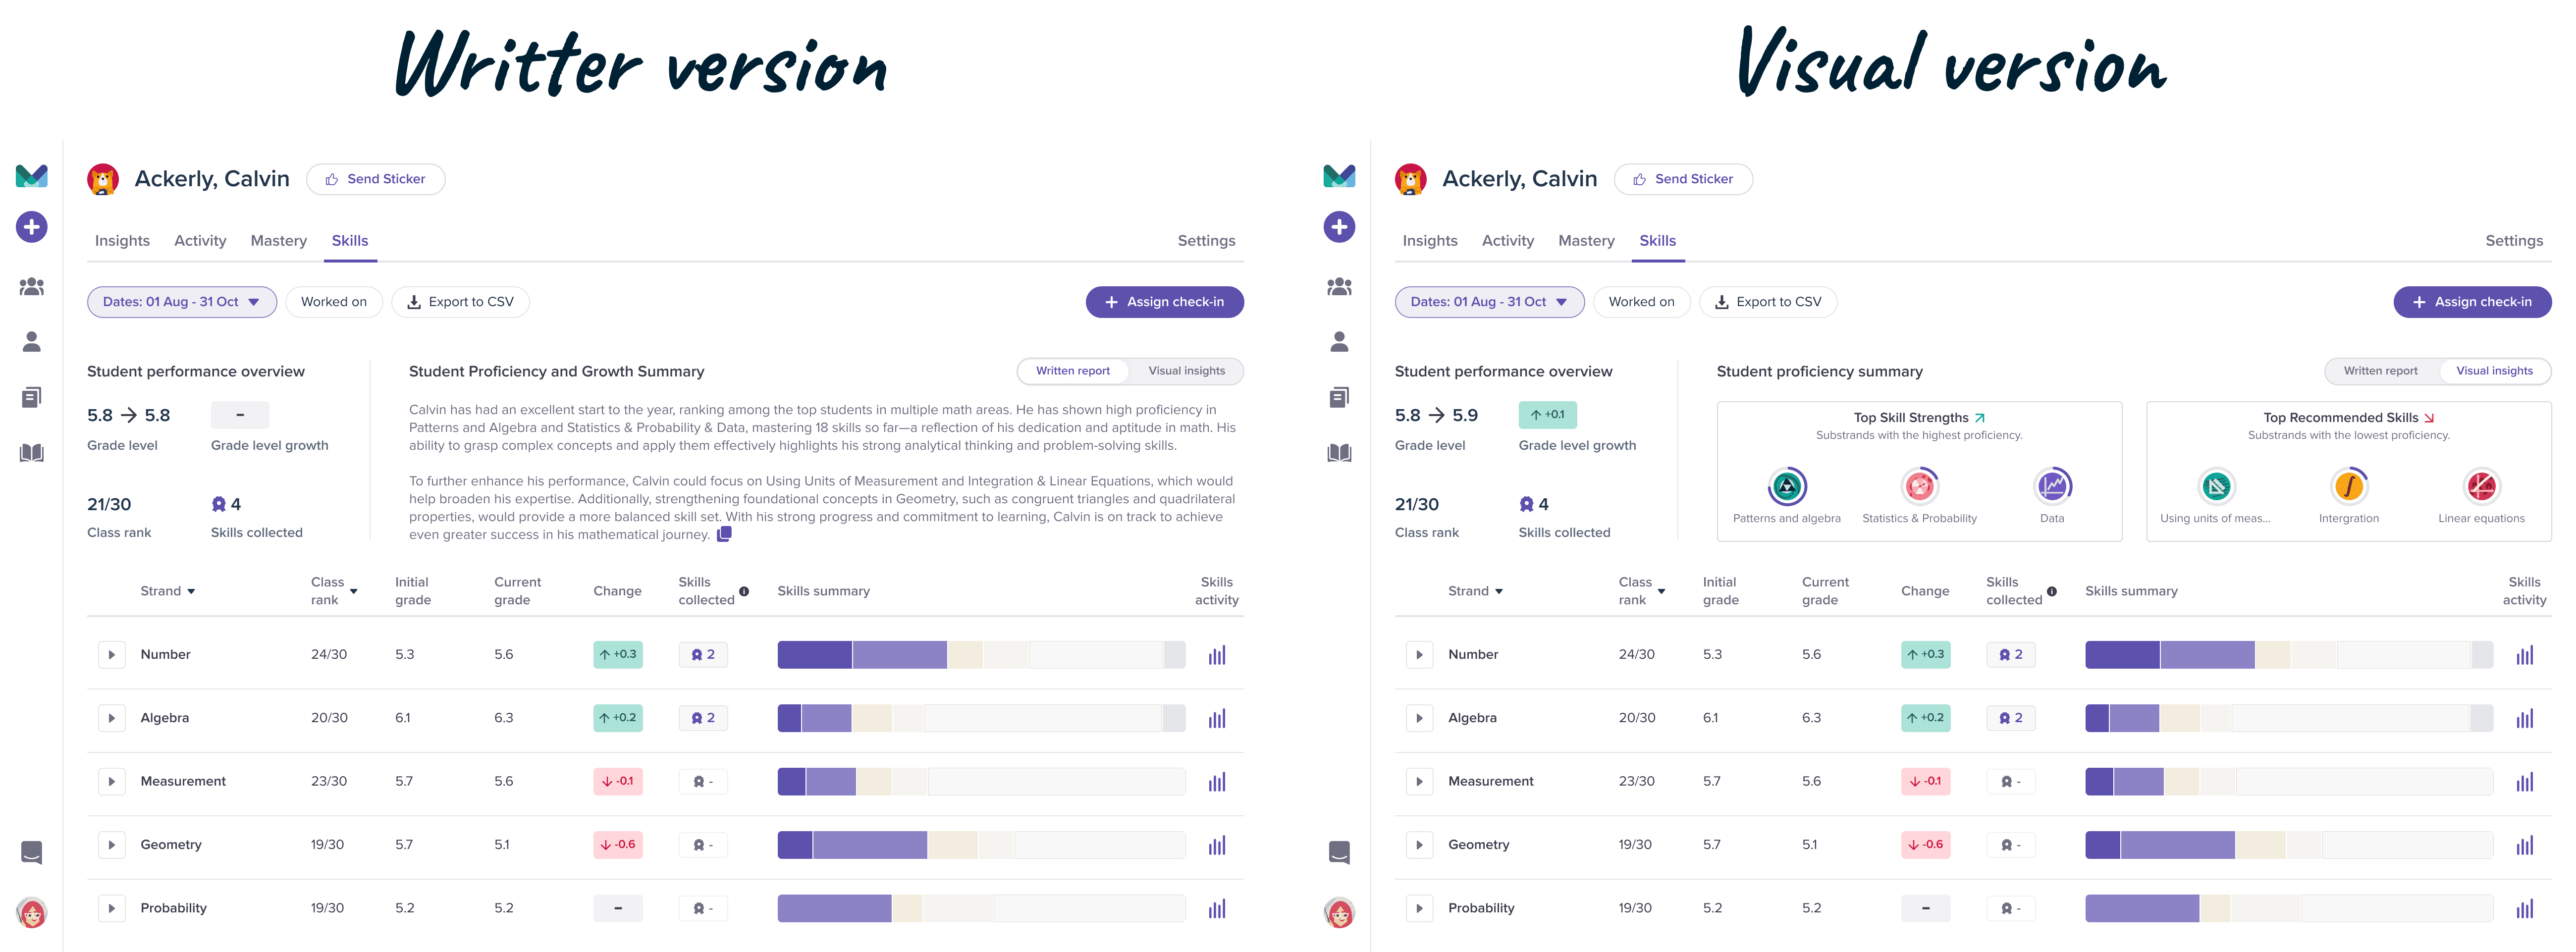
The final Student Skills Report design brings clarity to student performance by making strengths, weaknesses, and growth immediately visible, while reducing cognitive load and supporting remediation-focused teaching.
The final Student Skills Report design brings clarity to student performance by making strengths, weaknesses, and growth immediately visible, while reducing cognitive load and supporting remediation-focused teaching.
The final Student Skills Report design brings clarity to student performance by making strengths, weaknesses, and growth immediately visible, while reducing cognitive load and supporting remediation-focused teaching.
Usability Confirmation
Usability Confirmation
Usability Confirmation
A task-based usability test was conducted to confirm that teachers:
Can teachers identify student strengths and weaknesses using the updated Student Skills Report?
Do teachers understand the purpose and value of the Mathspace-generated summary?
A task-based usability test was conducted to confirm that teachers:
Can teachers identify student strengths and weaknesses using the updated Student Skills Report?
Do teachers understand the purpose and value of the Mathspace-generated summary?
A task-based usability test was conducted to confirm that teachers:
Can teachers identify student strengths and weaknesses using the updated Student Skills Report?
Do teachers understand the purpose and value of the Mathspace-generated summary?
Key qualitative findings
Teachers clearly understood which areas students struggled with most, without additional explanation.
The generated summary was perceived as useful for reporting and parent communication, and participants indicated they would actively use it.
Teachers appreciated the combination of text and visual elements, as well as the ability to explore subsections by clicking on icons.
Overall, teachers preferred the new design because it made learning gaps easier to identify and act on.
As no critical usability issues were identified, no further design iterations were required.
As no critical usability issues were identified, no further design iterations were required.
As no critical usability issues were identified, no further design iterations were required.
Outcome & Impact
Outcome & Impact
Outcome & Impact
Teacher Impact
Teacher Impact
Teacher Impact
The redesigned Student Skills Report improved how teachers understand and act on student performance.
Faster identification of strengths and learning gaps
Teachers were able to quickly understand which areas students struggled with most, without additional explanation.
Clearer reporting & communication
The Mathspace-generated summaries were perceived as useful and were likely to be used in reports and parent communication.
More confident decision-making
The combination of visual summaries and contextual text helped teachers move from insight to action with less cognitive effort.
Product & Platform Impact
Product & Platform Impact
Product & Platform Impact
While this redesign was part of a broader product ecosystem, improving report clarity plays an important role in teacher trust, retention, and adoption.
While this redesign was part of a broader product ecosystem, improving report clarity plays an important role in teacher trust, retention, and adoption.
While this redesign was part of a broader product ecosystem, improving report clarity plays an important role in teacher trust, retention, and adoption.
400,000+ MAU
400,000+ MAU
400,000+ MAU
Growing adoption across markets. Clearer teacher reports support trust and sustained usage.
Growing adoption across markets. Clearer teacher reports support trust and sustained usage.
Growing adoption across markets. Clearer teacher reports support trust and sustained usage.
0 Critical Usability Issues
0 Critical Usability Issues
0 Critical Usability Issues
Usability testing confirmed teachers could easily understand strengths, weaknesses, and summaries.
Usability testing confirmed teachers could easily understand strengths, weaknesses, and summaries.
Usability testing confirmed teachers could easily understand strengths, weaknesses, and summaries.
1 Validated Design Shipped
1 Validated Design Shipped
1 Validated Design Shipped
One confirmed layout taken to production, avoiding unnecessary iteration.
One confirmed layout taken to production, avoiding unnecessary iteration.
One confirmed layout taken to production, avoiding unnecessary iteration.
Scalable Reporting Foundation
Scalable Reporting Foundation
Scalable Reporting Foundation
Established a baseline for class- and district-level reporting.
Established a baseline for class- and district-level reporting.
Established a baseline for class- and district-level reporting.
Why This Matters
Why This Matters
Why This Matters
Teachers operate under time pressure—clarity directly impacts whether insights are used or ignored.
Reports that surface meaningful patterns quickly are more likely to influence teaching decisions.
Designing for actionability, not just completeness, helps educational data create real learning outcomes.
Reflection & Learnings
Reflection & Learnings
Reflection & Learnings
1. Clarity beats completeness in decision-making tools
1. Clarity beats completeness in decision-making tools
1. Clarity beats completeness in decision-making tools
In teacher-facing reports, showing everything is less valuable than showing the right thing clearly.
Reducing visual noise and prioritising scannability enabled teachers to identify learning gaps faster and act with confidence.
In teacher-facing reports, showing everything is less valuable than showing the right thing clearly.
Reducing visual noise and prioritising scannability enabled teachers to identify learning gaps faster and act with confidence.
In teacher-facing reports, showing everything is less valuable than showing the right thing clearly.
Reducing visual noise and prioritising scannability enabled teachers to identify learning gaps faster and act with confidence.
2. Validation is about knowing when to stop iterating
2. Validation is about knowing when to stop iterating
2. Validation is about knowing when to stop iterating
Not every project requires multiple design loops.
Clear early signals, supported by focused validation and usability confirmation, made it possible to confidently ship without unnecessary iteration, saving time and effort across teams.
Not every project requires multiple design loops.
Clear early signals, supported by focused validation and usability confirmation, made it possible to confidently ship without unnecessary iteration, saving time and effort across teams.
Not every project requires multiple design loops.
Clear early signals, supported by focused validation and usability confirmation, made it possible to confidently ship without unnecessary iteration, saving time and effort across teams.
3. Actionability defines the success of educational data
3. Actionability defines the success of educational data
3. Actionability defines the success of educational data
Insights only matter when they lead to action.
Teachers consistently valued summaries and visual patterns that helped them decide what to do next, reinforcing that usability is inseparable from instructional impact.
Insights only matter when they lead to action.
Teachers consistently valued summaries and visual patterns that helped them decide what to do next, reinforcing that usability is inseparable from instructional impact.
Insights only matter when they lead to action.
Teachers consistently valued summaries and visual patterns that helped them decide what to do next, reinforcing that usability is inseparable from instructional impact.
Closing Summary
Closing Summary
Closing Summary
This project demonstrated how thoughtful design decisions, grounded in research, validated with real users, and executed decisively, can transform complex educational data into clear, actionable insights.
By focusing on clarity, cognitive efficiency, and real teaching workflows, the redesigned Student Skills Report now supports better decision-making for teachers and establishes a scalable foundation for future reporting across Mathspace.
More of my work
More of my work
More of my work


Senior Product Designer with 7+ years of experience, focused on product thinking, education, and mentorship.
© 2026 Raden Rizqan // ICHAN — Built with intention.
Senior Product Designer with 7+ years of experience, focused on product thinking, education, and mentorship.
© 2026 Raden Rizqan // ICHAN — Built with intention.
Senior Product Designer with 7+ years of experience, focused on product thinking, education, and mentorship.
© 2026 Raden Rizqan // ICHAN — Built with intention.